Usage
ipyd3 is an interactive widgets library, it is based on ipywidgets and build using the widget-cookiecutter. The great thing about the library is that you can easily interact with a visualization and pass data from Python to the visualization and back.
Right now we have only implemented the Force Directed Graph functionality of the d3js library.
Lets look at an example of how to use the library.
# We will cover the requirements for the nodes and links later on.
graph = {"nodes":
      [
          {"id":"node1", "layer":"layer1", "color":"red", },
          {"id":"node2", "layer":"layer1", "color":"yellow"}
      ],
   "links":
       [
           {
               "source":"node1",
               "target":"node2",
               "layer":"layer1 - layer1"
           }
       ]

fg = ipyd3.ForceDirectedGraph(graph = graph)

fg
Once you run this you will get a graph that you can move, zoom, hover and get data about nodes, and many other features. We will see all the different features that a node can have in the following sections.
Graph
In usage you saw how to simply display a graph with data as parameter but that function takes more values than just graph.
ipyd3.ForceDirectedGraph(graph, label, icon, floater, height, width)
Attributes
- graph: Data to be passed to the graph. Required.
- Networkx graph
- dictionary in form of ex. {nodes: […], links:[…]}
- label: Boolean to show labels in graph. Default to True.
- icon: Boolean to show icons in graph. Default to True.
- floater: Boolean to show floater box with node info. Default to True.
- height: Height of graph area. Default to 500.
- width: Width of graph area. Default to 900.
All this attributes can be change after initialization of the graph to update the Graph.
Here is an example of removing the icons and floater information area.
# We will cover the requirements for the nodes and links later on.
graph = {"nodes":[
          {"id":"node1", "layer":"layer1", "color":"red", "group":"group1 },
          {"id":"node2", "layer":"layer1", "color":"yellow", "group":"group1},
          {"id":"node3", "layer":"layer1", "group":"group1", "group_color":"purple" },
      ],
   "links":[
           {
               "source":"node1",
               "target":"node2",
               "layer":"layer1 - layer1"
           }
       ]

fg = ipyd3.ForceDirectedGraph(graph = graph)

display(fg)

# hide floater and icon
fg.floater = False
fg.icon = False
Updating Graph
In order to update a graph, either add or remove nodes, all you have to do is change the graph attribute. This will put the add or remove nodes and update the graph. Below is an example.
# Lets add a new node to the graph
graph["nodes"].append({"id":"node6", "layer":"layer1", "color":"green"})
graph["links"].append({"source":"node1","target":"node6","layer":"layer1-layer1"})

fdg.graph = graph
Nodes
The backbone for the library are the nodes and the links, we shall look at what is required to create a node and what functions can be used.
There are 2 ways to generate the data in a format that the library will take. The first one you have already seen above with a dictionary in the format of { “nodes”: […], “links”: […] }. The other way is passing a NetworkX graph. We will discover how both of these work below.
Node Properties
In order to have a node there are a couple of properties that are needed for it to work with the library. This properties go into a dictionary and then those are appended to an array.
- id: Unique identifier for a node.Not necessarily a number. Required
- layer: Layer that the node belongs to. Required
- color: Color to give the node. Defaults to a random generated color if not set.
- radius: Size of the node to be displayed. Defaults to 20px
- icon: Icon to display in the middle of the node. This uses FontAwesome for the images.
- label: If label is set you can change what the node is showing in the graph.
- group: If group is set, and at least 2 other nodes have the same group, a grouping layer showing the nodes that are in the same group.
- group_color: Sets the color for the grouping layer.
If you would like to see what the icons are the class has an attribute called fa_codes that can be called by
print(ipyd3.ForceDirectedGraph.fa_codes.keys())
Generic Node Function
The class has a function that will help in the creation of a generic node. The function is called generic_node(id) were the only required value is id.
graph = {"nodes": [], "links": []}

node1 = ipyd3.ForceDirectedGraph.generic_node("node1", icon="fa-youtube")

# Lets add some extra features.
node1['label'] = "New Label!"
# Will appear in the node info but won't affect the node.
node1['description'] = "Just a description with nothing to add"

graph["nodes"].append(node1)
node2 = ipyd3.ForceDirectedGraph.generic_node("node2")
node2['icon'] = "fa-server"

graph["nodes"].append(node2)
Links
Now we will look at what is required to create a link and what functions can be used.
Link Properties
In order to have a link there are a couple of properties that are needed for it to work with the library. This properties go into a dictionary and then those are appended to an array.
- source: Unique Id of the node that is the source. Required
- target: Unique id of the node that is the target. Required
- layer: Layers of the target and source node. Required * This should be in the form of source_layer-target_layer
Generic Link Function
The class has a function that will help in the creation of a generic node. The function is called generic_link(source_id, target_id) were source and target node ids are required. Also you have the layer defaults to “default-default”.
link1_2 = ipyd3.ForceDirectedGraph.generic_link("node1", "node2")

graph["links"].append(link1_2)
NetworkX Graph
“NetworkX is a Python package for the creation, manipulation, and study of the structure, dynamics, and functions of complex networks.”. We will use NetworkX in order to create a graph that can be passed into the library. Layers are been set to default when the data is passed into the library. If you would like to change the layers you got to make sure to update both node and links.
import networkx as nx
nx_graph = nx.cycle_graph(10)
nx_graph.nodes[1]['title'] = 'Number 1'
nx_graph.nodes[1]['group'] = 1
nx_graph.nodes[3]['title'] = 'I belong to a different group!'
nx_graph.nodes[3]['group'] = 10
nx_graph.nodes[3]['label'] = "Label Test"
nx_graph.add_node(20, size=20, title='couple', group=2)
nx_graph.add_node(21, size=15, title='couple', group=2)
nx_graph.add_edge(20, 21, weight=5)
nx_graph.add_node(25, size=25, label='lonely', title='lonely node', group=3)

hw = ipyd3.ForceDirectedGraph(graph=nx_graph, height=500, width=900, floater=True)
hw
If you would like to change the any property of the graph before passing to the function you can call the Graph function that validates and generate the graph output outside of the class.
nx_graph_validated = ipyd3.Graph().validate("", nx_graph)
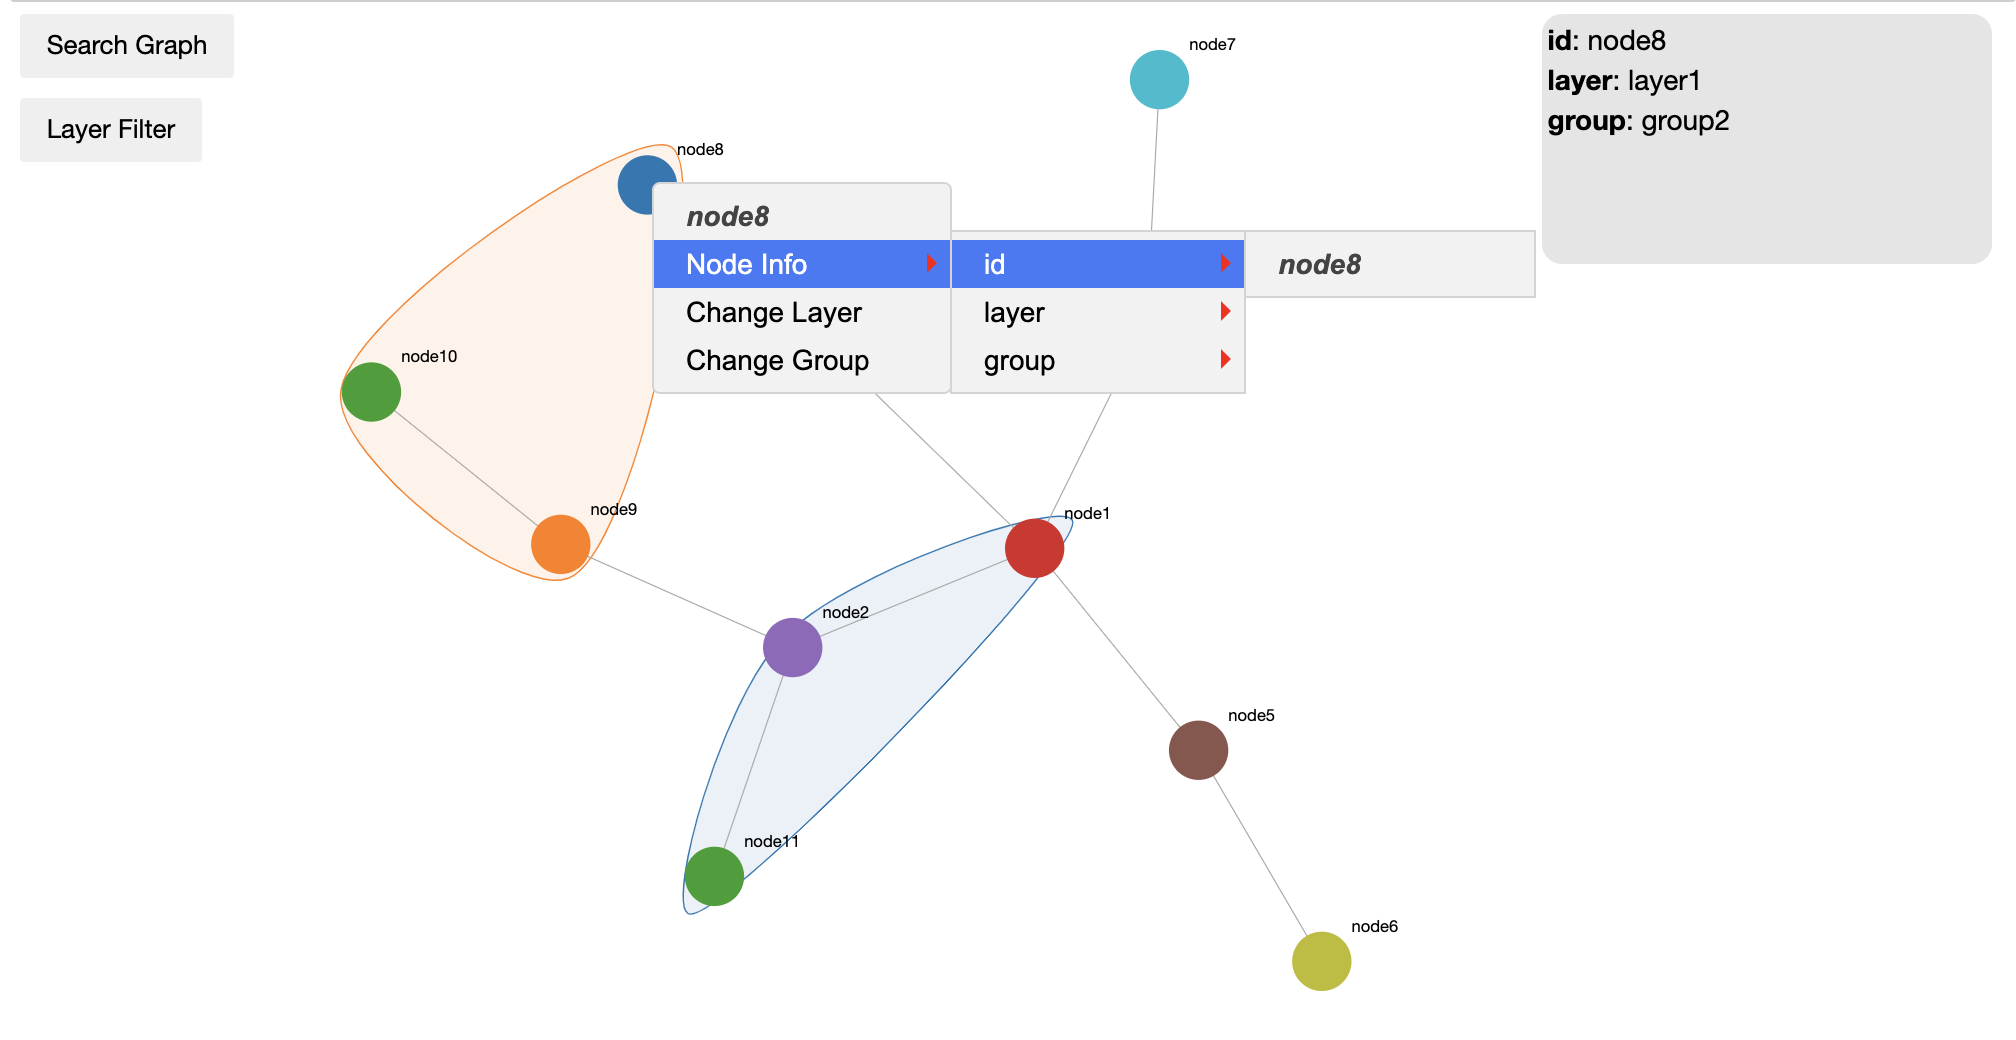
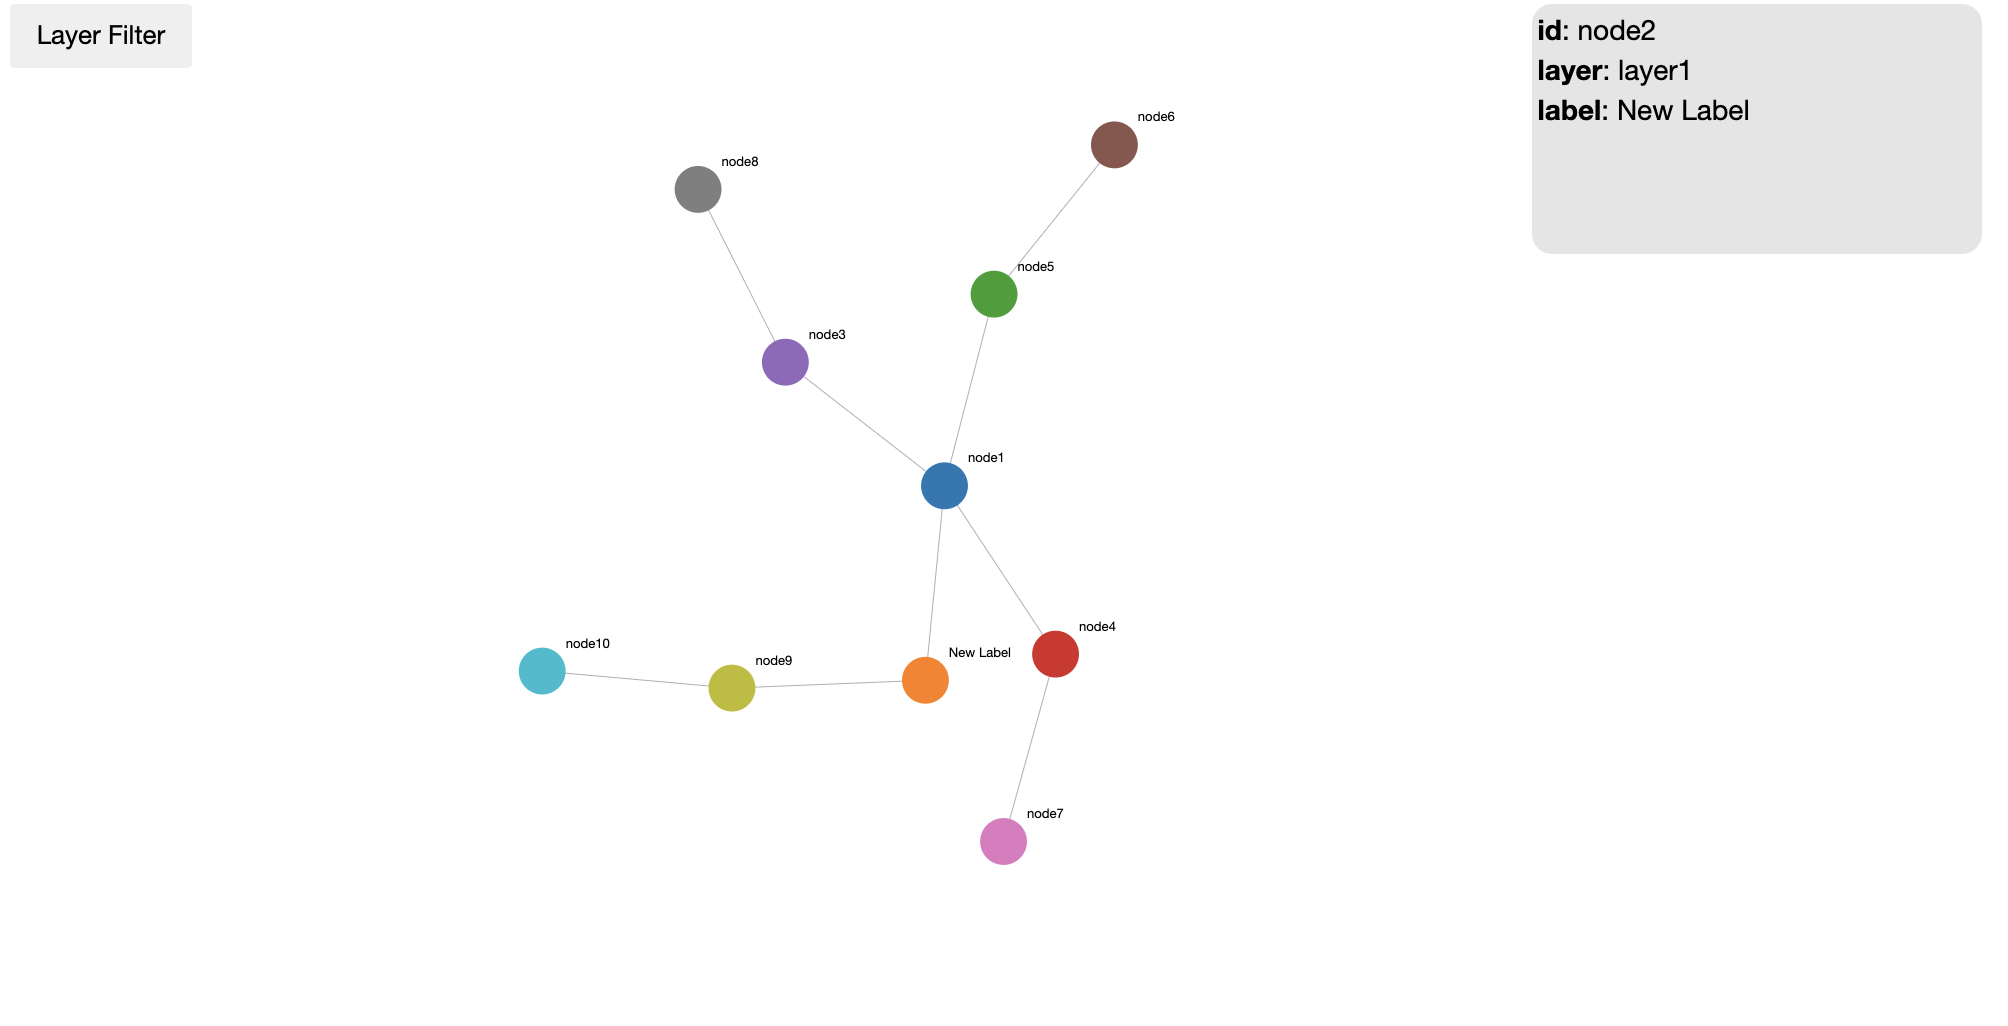
Extra Graph Features
The graph itself has a couple of extra features that need to be pointed out. If you look at the image below, you got a box on the top right corner showing the information for the node hovered over. You also have a button on the top left corner to show a dropdown of layers in a graph. This allows you to hide or display nodes associated to the layers. If you right click on a node you get the same information that you would get on the floater box but you also get the option to change a layer. This is a great feature when the user is trying to do some discovery directly on the graph. If a layer is already hidden and you add the node to that layer, the node will be hidden automatically.