Usage
ipyd3 is an interactive widgets library, it is based on ipywidgets and build using the widget-cookiecutter. The great thing about the library is that you can easily interact with a visualization and pass data from Python to the visualization and back.
Right now we have only implemented the Force Directed Graph functionality of the d3js library.
Lets look at an example of how to use the library.
 # We will cover the requirements for the nodes and links later on.
 data = {
 "name": "flare",
 "children": [
  {
   "name": "analytics",
   "children": [
    {
     "name": "cluster",
     "children": [
      {"name": "AgglomerativeCluster", "value": 3938},
      {"name": "CommunityStructure", "value": 3812},
      {"name": "HierarchicalCluster", "value": 6714},
      {"name": "MergeEdge", "value": 743}
     ]
    },
    {
     "name": "graph",
     "children": [
      {"name": "BetweennessCentrality", "value": 3534},
      {"name": "LinkDistance", "value": 5731},
      {"name": "MaxFlowMinCut", "value": 7840},
      {"name": "ShortestPaths", "value": 5914},
      {"name": "SpanningTree", "value": 3416}
     ]
    },
    {
     "name": "optimization",
     "children": [
      {"name": "AspectRatioBanker", "value": 7074}
     ]
    }
   ]
  }
 ]
}

 hg = ipyd3.HierarchicalGraph(data=data)

 hg
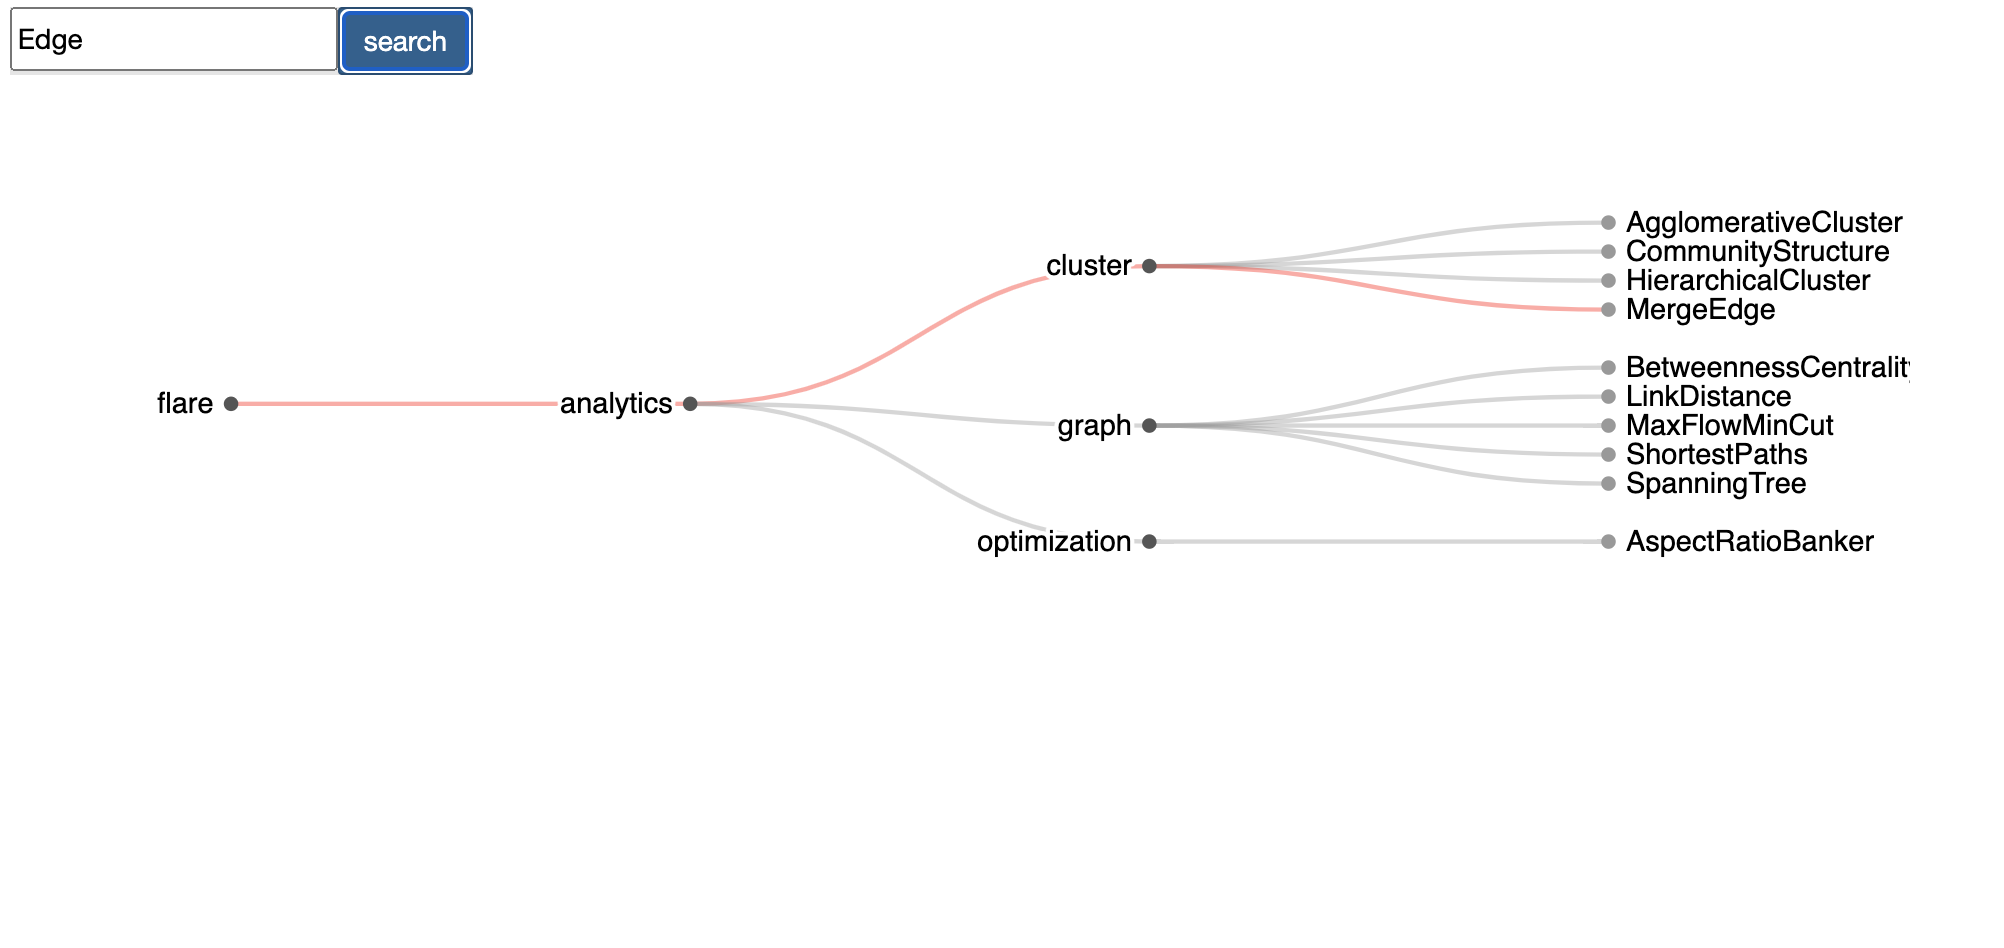
Once you run this you will get a graph that you can move, zoom, hover and get data about nodes, and many other features. We will see all the different features that a node can have in the following sections.
Graph
Under Construction….